Vladimir V. Apyari, Stanislava G. Dmitrienko, Viktoriya V. Arkhipova, Aydar G. Atnagulov and Yuri A. Zolotov
DOI: 10.1039/b000000x
Label-free gold nanoparticles were applied as a colorimetric probe for determination of cysteamine. The approach is based on aggregation of the nanoparticles leading to a change in absorption spectra and color of the solution. Influence of different factors (the presence of EDTA, pH, the concentrations of cisteamine and the nanoparticles) on the aggregation and analytical performance of the procedure was investigated. Potentiality of EDTA as a masking agent to eliminate interferences of metal cations was estimated. The method allows to determine cysteamine with a detection limit of 0.01 mgÀmL-1. It was applied to the analysis of a hair-waving formulation and urine.
Introduction
Cysteamine (2-Mercaptoethylamine) belongs to a chemical class of aminothiols. It is used as a drug for cystinosis treatment [1]. Cystinosis is an autosomal-recessive disease which stems from a mutation in CTNS gene that encodes a lysosomal carrier of cystine [2]. Cysteamine is probably only substance which has proved its efficiency as a suppressor of cystine deposition within lysosoms both in vitro and in vivo. The mechanism of its action consists in penetration lysosomal membranes and interaction with cystine by breakage S-S-bond forming free cysteine and cysteine-cysteamine disulfide, which is easily eliminated from a lysosome [1]. Besides, presence in cysteamineÆs chemical structure of easily oxidizing species makes it a potential antioxidant which can be used as a radioprotector [3]. Another application of cysteamine and its derivatives is hair-waving. In the hair-waving mixtures, cysteamine acts as a substance capable braking S û S-bonds in human hair so that they can be reconfigured in predetermined shape. Due to amino-functionality of the molecule, cysteamine cause minimal damage at good curl efficiency [4]. All mentioned facts make it actual a development of new analytical methods for cysteamine determination in different samples.
Various analytical methods for the determination of cysteamine have been described in the literature such as HPLC [5, 6], gas-chromatography [7], electrophoresis [8], different electrochemical methods [9 û 11]. However these methods have often lack sensitivity, they are expansive or require derivatization procedure [5, 6, 8]. These procedures are either complex or time-consuming. Development of sensitive and simple spectrophotometric techniques for determination of cysteamine are restrained by absence of chromophoric groups in cysteamine molecule and problems with its derivatization to get a colored product.
Gold nanoparticles have been suggested as peculiar chromogenic reagents [12 û 14]. Their unique optical properties are conditioned by surface plasmon resonance (SPR) that appears as an intense absorbance band in the visible range [15 û 17]. Its position depends on size and shape of the particles, their environment and the aggregative state [18,19]. The change in color during aggregation process is contrasting and can be used for detection of an analyte. This optical phenomenon has been already used for determination of different metal ions [20 û 26], anions [27 û 31] and organic compounds [32 û 38].
The aim of this work was to develop a simple and cost effective method for cysteamine determination using label-free gold nanoparticles.
Experimental
Materials
Chemically pure hydrogen tetrachloroaurate, sodium citrate and analytical grade cysteamine hydrochloride, cysteine, 2-mercaptoethanol, 3-mercaptopropionic acid, ethylenediaminetetraacetate disodium salt (EDTA), sodium hydroxide and hydrochloric acid were used. The substances stock solutions were prepared by dissolving their weighted portions in deionized water; stock 0.25 molÀL-1 solution of EDTA was prepared by dissolving the weighted portion of EDTA in 0.25 molÀL-1 NaOH.
Instrumentation
Absorbtion spectra of the solutions were recorded by SF-103 spectrophotometer (Akvilon, Russia), meanings of pH were measured by Ekspert 001 ion meter (Ekoniks, Russia), chromatograms were recorded by Tsvet Yauza chromatograph (NPO Khimavtomatika, Russia) with amperometric detector (E = +1 V). The chromatographic column Luna C18 was used. Eluent contained 35 % of acetonitrile and 65 % of water. It was passed through the column at a rate of 0.4 mLÀmin-1. Microphotographs of the samples were recorded using transmission electron
a)áááááááááááááááááááá áááááááááááááááááááááááááááááááááááááááááááááááááááb)
c)ááááááááááááá áááááááááááááááááááááááááááááááááááááááááááááááááááááááááád)
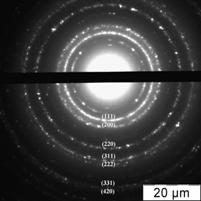
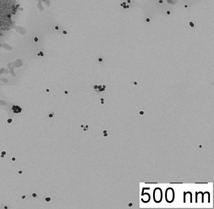
Fig. 1 Absorption spectrum of citrate capped gold NPs water solution (cNPs = 0.07 mmolÀL-1 áAu) (a), electron microphotography (b), histogram of size distribution (c) and electron diffraction pattern (d) of citrate capped gold NPs.
microscope LEO912 AB OMEGA (Carl Zeiss, Germany). Also a magnetic stirrer and a bulb heater were used.
Synthesis of label-free nanoparticles
Label-free nanoparticles (NPs) were prepared by reducing metal salt precursor (hydrogen tetrachloroaurate, HAuCl4) in a liquid phase by citrate according to the Frens method [39]. The main advantages of this method are narrow size distribution, an intense absorbance band in a solution at 525 nm and ability to aggregate easily in the presence of several substances, that results in appearing the aggregate band at 650 û 750 nm.
Briefly, 1 mL of 1 % HAuCl4 was introduced in 250 mL bulb, diluted with 100 mL of deionized water and heated until boiling. 1.4 mL of 1 % sodium citrate was added to the hot solution at stirring. The solution was boiling in 5 min till stable ruby color. The mixture was cooled at stirring and kept in the dark place for 24 hours to achieve re-crystallization and complete stabilization of NPs. Concentration of NPs in final solution was 70 mgÀmL-1 (0.35 mmolÀL-1á in terms of gold). The as-prepared label-free gold NPs were characterized with UV-vis absorption spectra, transmission electron microscopy (TEM) and electron diffraction (ED).
Characterization of label-free nanoparticles
As it was mentioned above, an important feature of gold NPs is the presence of SPR band at 510 û 530 nm in the absorption spectra. The spectrum of diluted water solution of NPs synthesized as described above is given in Fig. 1a. The maximum of the absorbance band is located at 525 nm. According to the literature [40 û 42] a position and shape of the SPR band depends on the material, size and form of a particle as well as medium around it. In case of gold NPs in aqueous solutions, the position at 520 û 530 nm corresponds to the particles of less than 40 nm in diameter [41, 43]. Calculation of the absorbance at the maximum normalized to size independent meaning at 440 nm results in meaning 1,8 that according to [40] corresponds to the particles larger than 20 nm.
The presence of NPs in the solution was proved by electron microscopy. As it can be seen from microphotography (Fig. 1b) and histogram of size distribution (Fig. 1c), NPs of 18 û 26 nm predominate in the solution, average diameter of NPs is 23 nm. Electron diffraction pattern of the particles (Fig. 1d) confirmed that these nanoparticles are gold.
Determination of cysteamine
To construct a calibration curve, 0 û 0.25 mg of cysteamine were introduced in a test-tube and diluted with deionized water up to 3.9 mL. Then 0.1 mL of 0.25 molÀL-1 EDTA and 1 mL of NPs solution (c=0.35 mmolÀL-1á Au) were added succesively. The total volume of all components was 5 mL. Absorption spectra were recorded after 2 min of the reaction. The calibration curve was constructed as А750/А525 ratio versus the concentration of cysteamine.
a)áááááááááááááááááááááááááááááááááááááááááááááááááááááááááááááááááááááááááááááááááá b)
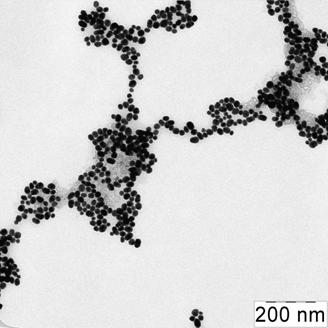
Fig. 2 Absorption spectra (a) of citrate capped gold NPs water solutions in absence of thiol-containing substance (1) and in presence of 100 mgÀmL-1 2-mercaptoethanol (2), cysteine (3), 3-mercaptopropionic acid (4) and 0.03 mgÀmL-1 cysteamine (5); and microphotography of NPs aggregates (b). cNPs = 0.07 mmolÀL-1 áAu
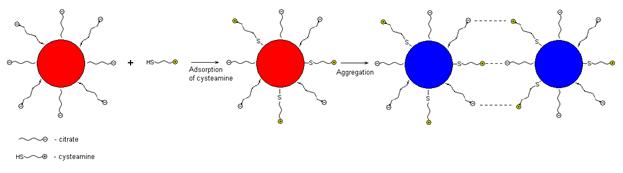
Scheme 1 Aggregation of gold NPs under the influence of cysteamine.
Results and discussion
The label-free NPs are stable in the solution and prevented against aggregation owing to the electrostatic repulsion between negatively charged citrate ions on NPs surfaces. When adding different in respect of acid-base properties thiol-containing substances, it was found that only cysteamine caused aggregation of NPs already at concentration of 0.03 mgÀmL-1 (Fig. 2). 2-Mercaptoethanol, cysteine and 3-mercaptopropionic acid did not remarkably affect NPs aggregative state even at concentration of 100 mgÀmL-1. Aggregation became apparent as appearing a new absorbance band at 750 nm and decreasing the band at 525 nm (Fig. 2a). The color of the solution was changed from ruby to blue. TEM-image of the solution after addition of cysteamine showed the presence of NPs aggregates. Several aggregates had prominent chain shape (Fig. 2b).
We assume that the effect observed is connected with different ionic state of the substances. At the experimental conditions (pH 4.5) organic base cysteamine (pKb = 3.7) is protonated and charged positively; cysteine exists as a zwitterion (рКа=2.1, рКb = 3.0); 2-mercaptoethanol û as a neutral molecule and 3-mercaptopropionic acid û preferably as an anion (рКа=4.3). Sorption of cysteamine on the NP surface results in decreasing the negative charge and repulsion of NPs as well as gives rise to their crosslinking via positively charged ammonium group of cysteamine and negatively charged citrate group. Both these factors promote aggregation. Aggregation of NPs under the influence of cysteamine can be described by Scheme 1.
It is well known that aggregation of NPs can be induced by metal cations, especially multicharged. To eliminate the interferences caused by metal ions we suggested adding into the solution such masking agent as EDTA. The main advantages of this compound are effectiveness of chelating, colorlessness of the complexes and
Fig. 3 EDTA (2 û 5). cNPs = 0.07 mmolÀL-1á Au; ccyst, mgÀmL-1: 0 (1, 5), 0.1 (2 û 4); cEDTA, mmolÀL-1: 0 (1, 2), 5 (3), 10 (4), 15 (5).
their existence as negatively charged ions. The later is especially important in a view of mechanism described above.
Influence of different factors on aggregation of NPs under the influence of cysteamine
It was investigated an influence of EDTA concentration, pH, concentrations of NPs and cysteamine on the aggregation. The degree of aggregation was estimated by comparing the absorbtion spectra and ratio of absorbances at wavelengths corresponding to the aggregates and individual NPs А750/А525. According to the literature [27, 37] this ratio is often used for calibration curve plotting while determining metals and organic compounds.
Influence of EDTA. The interaction of gold NPs with cysteamine was performed in the presence of EDTA. The absorption spectra at different concentration of EDTA are given in Fig. 3. It can be seen that EDTA does not affect aggregation of NPs in the presence of 0.1 mgÀmL-1 cysteamine up to the concentration of 10 mmolÀL-1á (curves 2 û 4) therefore it can be used for masking metal ions. At the concentrations higher 10 mmolÀL-1 aggregation was observed even in the absence of cysteamine (curve 5). It can be caused by high ionic strength leading to decrease in the double electrical layer thickness and coagulation stability of the colloid system. In all further experiments concentration of EDTA was chosen as 5 mmolÀL-1.
Influence of pH. The dependence of NPs aggregation in the presence of cysteamine on pH was investigated. The acidity required was adjusted by HCl and NaOH solutions. Corresponding dependences are depicted in Fig. 4. According to the figure cysteamine causes aggregation at pH 3 û 8. When pH < 3 hydrogen ions lead to aggregation along with cysteamine. At pH > 7 aggregation decreases that can be ascribed to partial deprotonation of cysteamine and increase in dissociation degree of citrate ions on the NPs surface leading to increase in their charge and stability of the system. In all further experiments pH was adjusted to 7 û 8. Such pH values are more preferable than pH 3 û 7 because of higher effectiveness of EDTA as masking agent at high pH.
a)
b)
Fig. 4 Dependence of А750/А525 ratio on pH in the absence (1) and in the presence (2) of 0.03 mgÀmL-1 cysteamine (a) and corresponding difference of the signals (b). cNPs = 0.07 mmolÀL-1 áAu, cEDTA = 5 mmolÀL-1.
a)áááááááááááááááááááááááááááááááááááááááááááááááááááááááááááááááááááááááááááááááááááááááááááááááá b)
Fig. 5 Absorbtion spectra of NPs solutions at different cysteamine concentration (a) and dependence of А750/А525 ratio on the concentration of cysteamine (b). cNPs = 0.07 mmolÀL-1á Au, cEDTA = 5 mmolÀL-1, pH 7.5; a) ccyst, mgÀmL-1: 0 (1), 0.01 (2), 0.03 (3), 0.05 (4), 0.1 (5).
 Fig. 6 Dependences
of А750/А525 ratio on the concentration of cysteamine at different
concentration of NPs. cNPs, mmolÀL-1 áAu: 0.07 (1), 0.2
(2) and 0.5 (3); cEDTA = 5 mmolÀL-1, pH 7.5.
Fig. 6 Dependences
of А750/А525 ratio on the concentration of cysteamine at different
concentration of NPs. cNPs, mmolÀL-1 áAu: 0.07 (1), 0.2
(2) and 0.5 (3); cEDTA = 5 mmolÀL-1, pH 7.5.
Influence of cysteamine concentration. Absorbtion spectra of NPs solutions at different cysteamine concentration are given in Fig. 5a. One can see that when the concentration of cysteamine is increased, a decrease in surface plasmon resonance band of individual NPs at 525 nm and an increase in NPs aggregates band at 750 nm are observed. Fig. 5b demonstrates a dependence of А750/А525 ratio on the concentration of cysteamine. Cysteamine causes aggregation of NPs at concentrations higher 0.01 mgÀmL-1. The ratio А750/А525 is near linearly depends on the cysteamine concentration in a range 0.01 û 0.05 mgÀmL-1 (R=0.992). At concentrations higher 0.05 mgÀmL-1, maximally achieved at these conditions aggregation is observed.
Influence of NPs concentration. The dependences of А750/А525 ratio on the concentration of cysteamine at different NPs concentrations (0.07, 0.2 and 0.5 mmolÀL-1 áAu) are shown in Fig. 6. All of the curves have a linear part that can be used for spectrophotometric determination of cysteamine. It was shown that increasing concentration of NPs results in the broadening of linearity range but decreases sensitivity of the system. Besides it makes the determination more expansive.
Analytical features of the method
The analytical features of the spectrophotometric determination of cysteamine using label-free gold NPs are given in Table 1. Detection limits were calculated like one usually makes it in ionometry û as an abscissa of intercept point of tangents to the linear parts of dependence of А750/А525 ratio on the concentration of cysteamine (see Fig. 5b).
Table 1 Analytical ranges, detection limits and RSD values for determination of cysteamine using citrate capped gold NPs
|
Table 2
Determination of cysteamine in hair-waving formulation
(n = 3, P = 0.95)
|
||||||||||||
The obtained data shown that analytical performance of the method can be changed by varying NPs concentration in the solution under analyzing (Table 1).
Selectivity of the method was evaluated. It was found that the determination of 0.05 mgÀmL-1 of cysteamine was no affected by at least 2000-fold amount of Na+, K+, HCO3-, SO42-, Cl- and 100-fold amount of Ca2+, Mg2+, Mn2+, Fe3+, Cu2+, Zn2+.
It should be mentioned that an important feature of the developed method is easiness to carry out a semiquantitative test-determination. The colors of NPs in the absence and in the presence of cysteamine are contrast and can be easily distinguished by an eye.
Application to real samples
The method developed was applied to determination of cysteamine in a formulation for hair-waving ôCutrin« Sensi Perfectionö. Apart from cysteamine, this formulation contains ethanolamine, Oleth-20 (polyethyleneglycol oleyl ester), ammonium hydrocarbonate, perfume, polyvinylpyrrolidone and pentasodium diethylenetriaminepentaacetate. The sample preparation included only successive dilution with deionized water. An aliquot of the diluted sample was transferred into test-tube and processed as described in the Experimental section. The sample was also analyzed by high-performance liquid chromatography with amperometric detection. The result given in Table 2 is in accordance with one obtained by HPLC.
The method was applied to the analysis of model samples on base of urine. The urine was collected from a volunteer and stored at -4 ║C. The sample pretreatment included centrifugation at 5000 min-1 for 15 min and filtration through paper filter. Volume of urine used per one experiment was 0.75 mL. The results are represented in Table 3. They indicate good precision and reproducibility of the determination. Concentration of cysteamine in the urine was (0.10 ▒ 0.04) mgÀmL-1. According to the literature, the content of cysteamine in urine of healthy people varies from 0.1 to 1 mgÀmL-1 [44].
Table 3
Determination of cysteamine in model urine samples
(n = 3, P = 0.95)
|
Conclusions
Label-free gold NPs can be easily aggregated in the presence of cysteamine that results in change their optical properties and color of the solution and can be used for determination of this substance. It has been shown that EDTA can be used as masking agent to eliminate interferences of metal cations. The optimal conditions of the determination have been achieved in 5 mM EDTA at pH 7 û 8.
It has been found that А750/А525 ratio is linearly related to the concentration of cysteamine that allows to determine it spectrophotometrically with detection limit 0.01 mgÀmL-1. Metrological performance of the method can be changed by varying concentration of NPs in the solution.
The approach has been applied to the analysis of a hair-waving formulation and urine. Label-free gold nanoparticles are easy to obtain by simple and well-known procedure. The method suggested is sensitive, rapid, cost-effective and can be applied both as quntitative and as semiquantitative test.
Acknowledgements
We thank the scientific instrument sharing center of Lomonosov Moscow State University and Prof. S.S. Abramchuk for recording TEM-images of the samples.
References
1. W.A. Gahl, Eur. J. Pediatr., 2003, 162, 538 û 541.
2. W.A. Gahl, J.G. Thoene and J.A. Schneider, N. Engl. J. Med., 2002, 347, 111 û 121.
3. L.R. Feksa, V.C. Rech, D.A. Silna Melo, M. Wajner, C.S. Dutra-Filho, A.T. Souza Wyse and C.M.D. Wannmacher, Metab. Brain Dis., 2008, 23, 81 û 93.
4. US Pat., 5362487, 1994.
5. J. Ogony, S. Mare, W. Wu and N. Ercal, J. Chromatogr. B, 2006, 843, 57 û 62.
6. K. Kusmierek, R. Glowacki and E. Bald, Anal. Bioanal. Chem., 2005, 382, 231 û 233.
7. H. Kataoka, H. Tanaka and M. Makita, J. Chromatogr. B, Biomed. Appl., 1994, 657, 9 û 13.
8. P. Lochman,T. Adam, D. Fredecky, E. Hlidkova and Z. Stopover, Electrophoresis, 2003, 24, 1200 û 1207.
9. J.-B. Raoof, R. Ojani and F. Chekin, J. Electroanal. Chem., 2009, 633, 187 û 192.
10. J.-B. Raoof, R. Ojani and F. Chekin, J. Mater. Sci., 2009, 44, 2688 û 2693.
11. W.X. Cheng, D.Y. Peng, C.H. Lu and C.W. Fang, Rus. J. Electrochem., 2008, 44, 1052 û 1057.
12. X. Liu, M. Atwater, J. Wang and Q. Huo, Colloids Surf. B., 2007, 58, 3 û 7.
13. D. Liu, Z. Wang and X. Jiang, Nanoscale, 2011, 3, 1421 û 1433.
14. Y. Sun and Y. Xia, Analyst, 2003, 128, 686 û 691.
15. S.K. Ghosh and T. Pal, Chem. Rev., 2007, 107,. 4797 û 4862.
16. J.J. Saarinen, E.M. Vartiainen and K.-E. Peiponen, Sensor. Actuat. B, 2009, 138, 383 û 395.
17. Uechi and S. Yamada, Anal. Bioanal. Chem., 2008, 391, 2411 û 2421.
18. E. Hutter and J.H. Fendler, Adv. Mater., 2004, 16, 1685 û 1706.
19. A.J. Haes and R.P. van Duyne, Expert. Rev. Mol. Diagn., 2004, 4, 527 û 537.
20. Y.-W. Lin, C.-C. Huang and H.-T. Chang. Analyst, 2011, 136, 863 û 871.
21. T. Lou, L. Chen, C. Zhang, Q. Kang, H. You, D. Shen and L. Chen, Anal. Methods, 2012, 4, 488 û 491.
22. W. Chansuvarn and A. Imyim, Microchim. Acta, 2012, 176, 57 û 64.
23. X. Ying, H. Zhao, Z. Wu, X. Li, Y. He and Z. Yuan, Analyst, 2011, 136, 3725 û 3730.
24. J. Xin, L. Miao, S. Chen and A. Wu, Anal. Methods, 2012, 4, 1259 û 1264.
25. B.L. Li, Y. Du and S.J. Dong, Anal. Chim. Acta, 2009, 644, 78 û 82.
26. X.-M. Miao, L.-S. Ling and X.-T. Shuai, Anal. Biochem., 2012, 421, 582 û 586.
27. F. Tan, X. Liu, X. Quan, J. Chen, X. Li and H. Zhao, Anal. Methods, 2011, 3, 343 û 347.
28. M. Zhang, Y.-Q. Liu and B.-C. Ye, Analyst, 2011, 136, 4558 û 4562.
29. M.H. Kim, S. Kim, H.H. Jang, S. Yi, S.H. Seo and M.S. Han, Tetrahedron Lett., 2010, 51, 4712 û 4716.
30. J. Zhang, X. Wang and X. Yang, Analyst, 2012, 137, 2806 û 2812.
31. W.L. Daniel, M.S. Han, J.-S. Lee and C.A. Mirkin, J. Am. Chem. Soc., 2009, 131, 6362 û 6363.
32. C.-L. Kuong, W.-Y. Chen and Y.-C. Chen, Anal. Bioanal. Chem., 2007, 387, 2091 û 2099.
33. Y. Wang, L. Zhan and C.Z. Huang, Anal. Methods, 2010, 2, 1982 û 1988.
34. D. Liu, W. Chen, J. Wei, X. Li, Z. Wang and X. Jiang, Anal. Chem., 2012, 84, 4185 − 4191.
35. L. Li and B. Li, Analyst, 2009, 134, 1361 û 1365.
36. Y. Li, Y. Duan, J. Li, J. Zheng, H. Yu and R. Yang, Anal. Chem., 2012, 84, 4732 − 4738.
37. L. Guo, J. Zhong, J. Wu, F. Fu, G. Chen, X. Zheng and S. Lin, Talanta, 2010, 82, 1654 û 1658.
38. X. Liang, H. Wei, Z. Cui, J. Deng, Z. Zhang, X. You and X.-E. Zhang, Analyst, 2011, 136, 179 û 183.
39. G. Frens, Nat. Phys. Sci., 1973, 241, 20 û 22.
40. U. Kreibig and L. Genzel, Surface Science, 1985, 156, 678 û 700.
41. J. Turkevich, Gold Bull., 1985, 18, 125 û 131.
42. R. Doremus, S.-C. Kao and R. Garcia, Appl. Opt., 1992, 31, 5773 û 5778.
43. S.K. Gosh, Colloids. Surf. A.: Physicochem. Eng. Aspects, 2010, 371, 98 û 103.
44. H. Kataoka, H. Tanaka and M. Makita, J. Chromatogr. B, 1994, 657, 9 û 13.